InSAR analysis saves the City of Diemen € 200.000 annually.
SkyGeo measures displacement with millimeter accuracy of every road in the city of Diemen. Maintenance planners receive displacement rates for all neighborhoods, based on satellite recordings since 1992. For the first time, the maintenance planning for roads and sewers is based on a complete set of quantitative data. These data provide new insights. As a result, the city is able to save € 200.000 annually on maintenance expenditures.
“Problems we had for years with manual measurements were resolved at once.”
Ron Kaptijn
Policy Officer Infra, City of Diemen
Preventing damage due to displacement
The municipality of Diemen is built on very soft soil. Decomposition of peat leads to rapid displacement up to 50 centimeters in 20 years. Differences in soil composition cause the displacement rates to vary drastically between neighborhoods and even within streets. Maintenance is required where displacement exceeds 20 centimeters – the diameter of sewage pipes, which will not drain at this point anymore. To prevent service interruptions, the municipality has to perform periodic reconstruction and elevation of roads and drainage per neighborhood.

Subsidence in the city of Diemen leads to many inconveniences. But also dangerous situations, like breaking gas pipes

Subsidence Map of Diemen. Subsidence varies drastically from street to street.
Scheduling maintenance cycles
The municipality has an annual budget of € 2,2 million to maintain roads and sewers for its 20.000 citizens. Until now, displacement was measured by visual inspection, which is neither precise, nor repeatable, nor geographically complete. Differences in displacement rates are difficult to quantify this way, making maintenance either unnecessarily early or to late.
Mapping displacement accurately
SkyGeo uses radar images recorded by satellites since 1992 to determine displacement in millimeters for thou- sands of locations throughout the municipality. From the resulting map, the city determines the mean time before maintenance of roads and sewers based on extrapolating the long term results to the next 20 years.

Subsidence varies drastically from street to street.
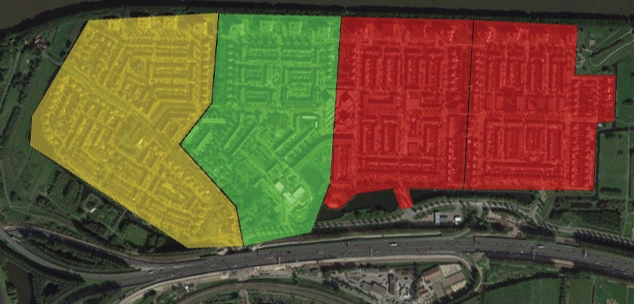
Aggregation of displacement data from picture above. The 20 percentile points are converted to a map with an indication of the mean time before failure in years.
Efficient maintenance plans
Next, Subsidence Map enables the city to accurately calculate maintenance cycles at every level (buildings, streets, neighborhoods). The Subsidence Map shows the dynamics of the displacement, so the city can better prevent possible sewer emergencies.
Better expenditure allocation
The Subsidence Map also suggested that maintenance can be safely postponed in many neighborhoods. This leads to considerable savings in annual maintenance expenditure and a reduction of impact of construction work in the neighborhood.

Differential settlements in a sewage system by projection of displacement data on the pipelines.