
THE NEW BODEMDALINGSKAART
The most up-to-date ground motion measurements in the Netherlands
National ground motion monitoring for the Netherlands
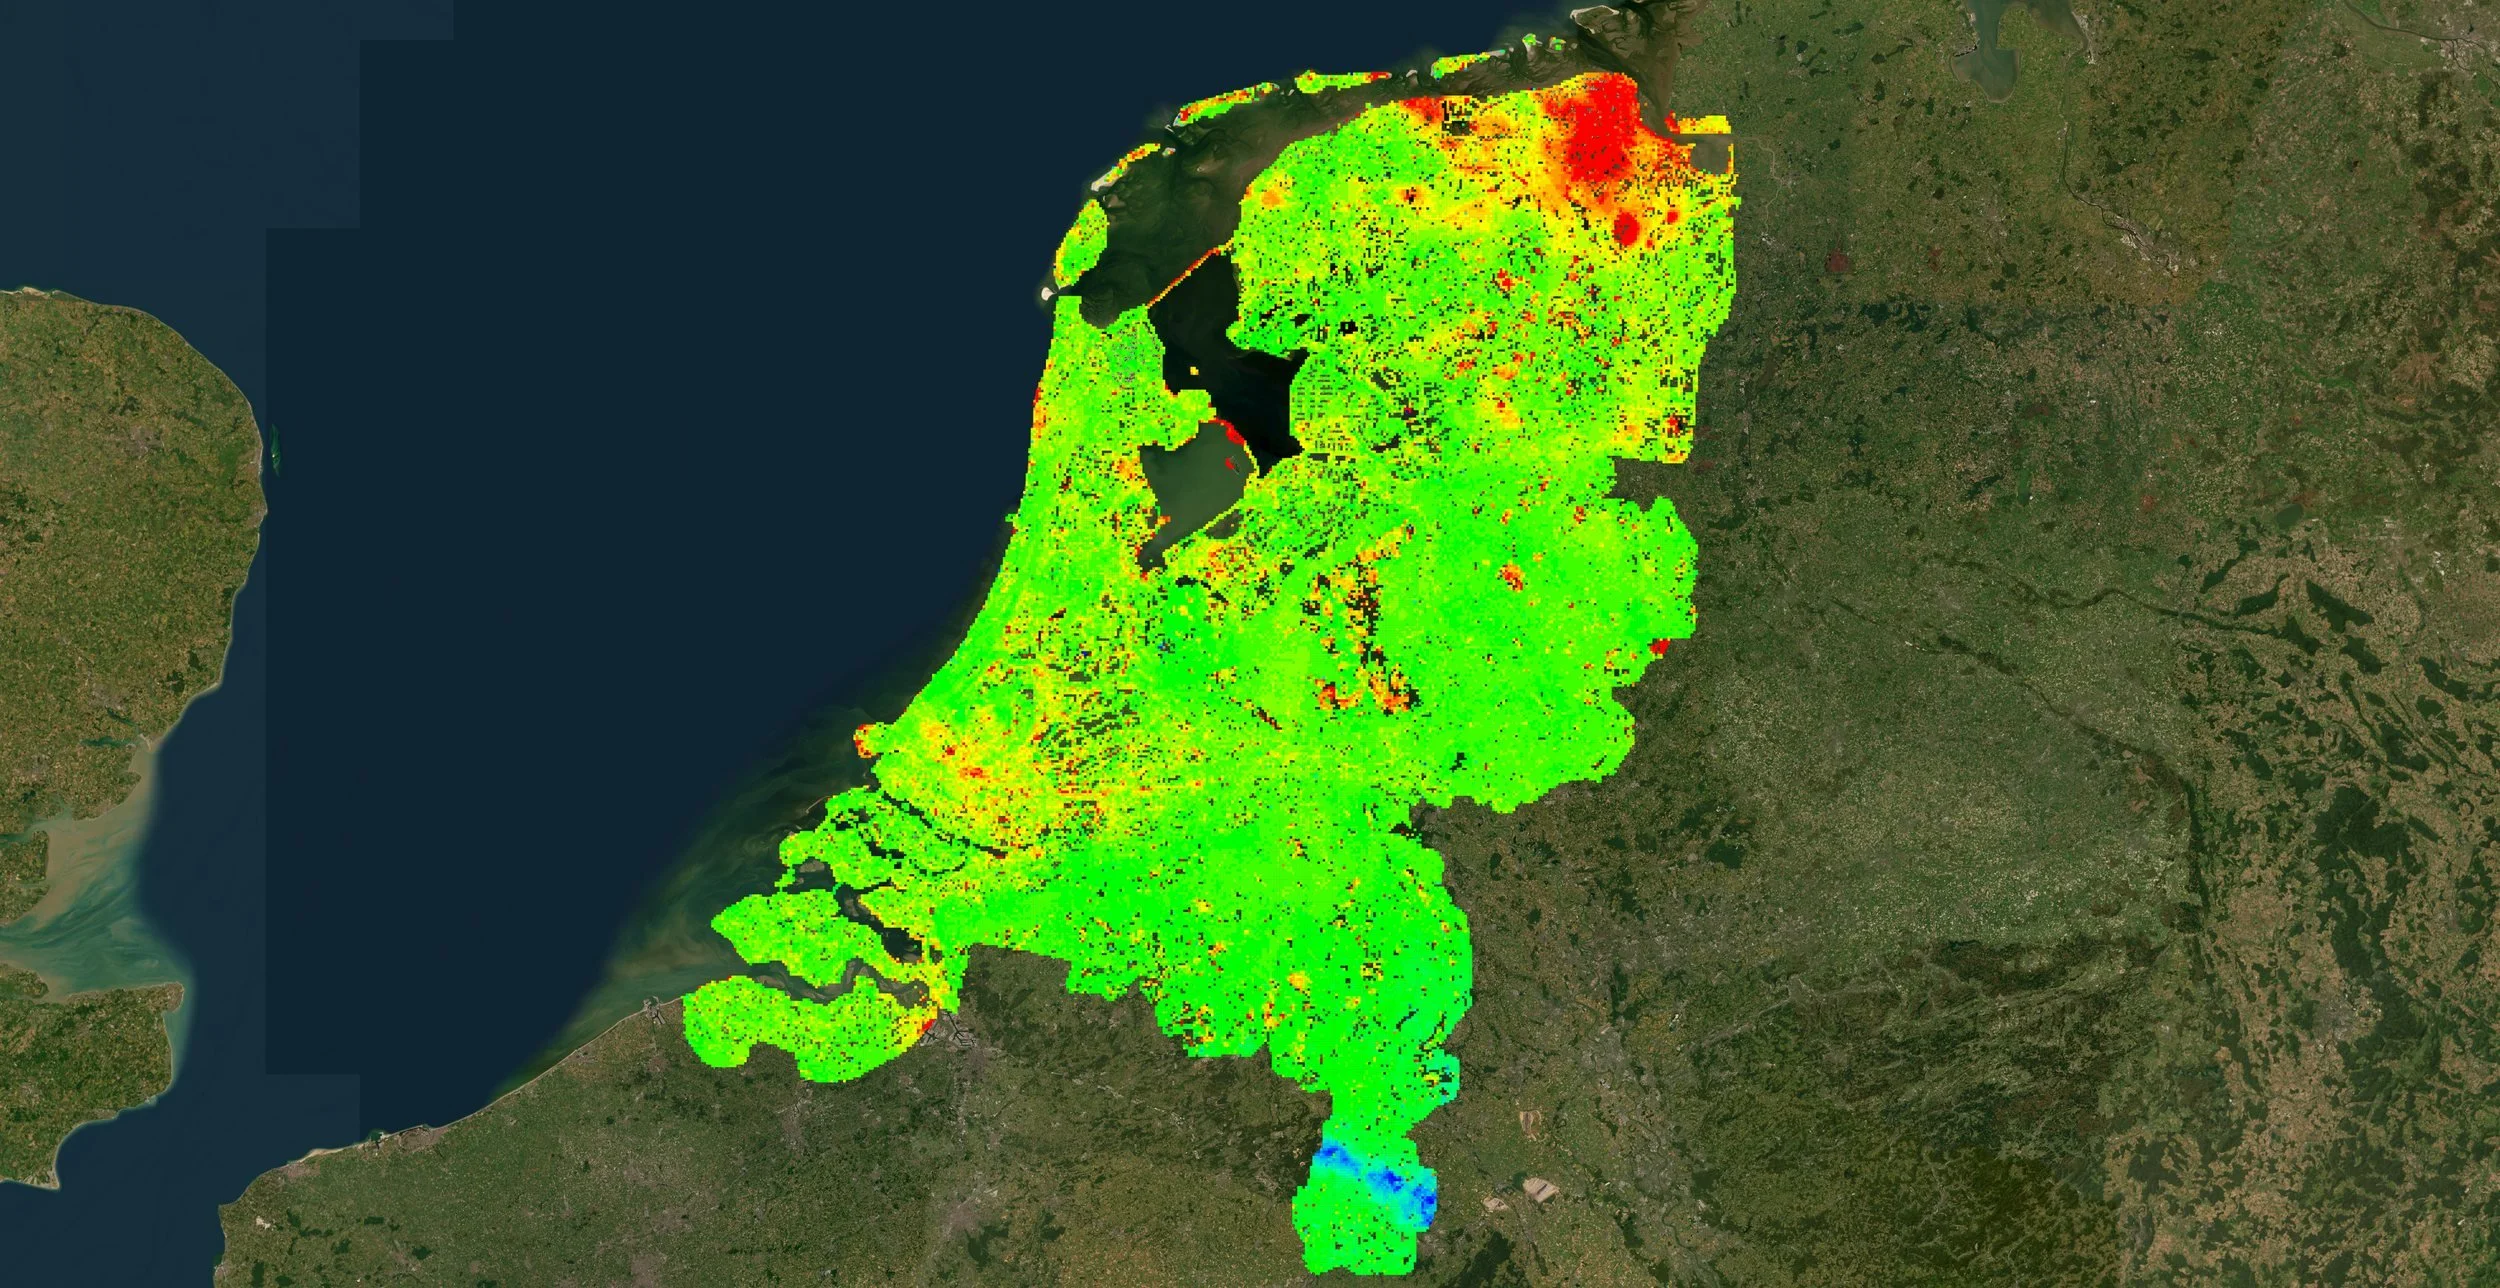
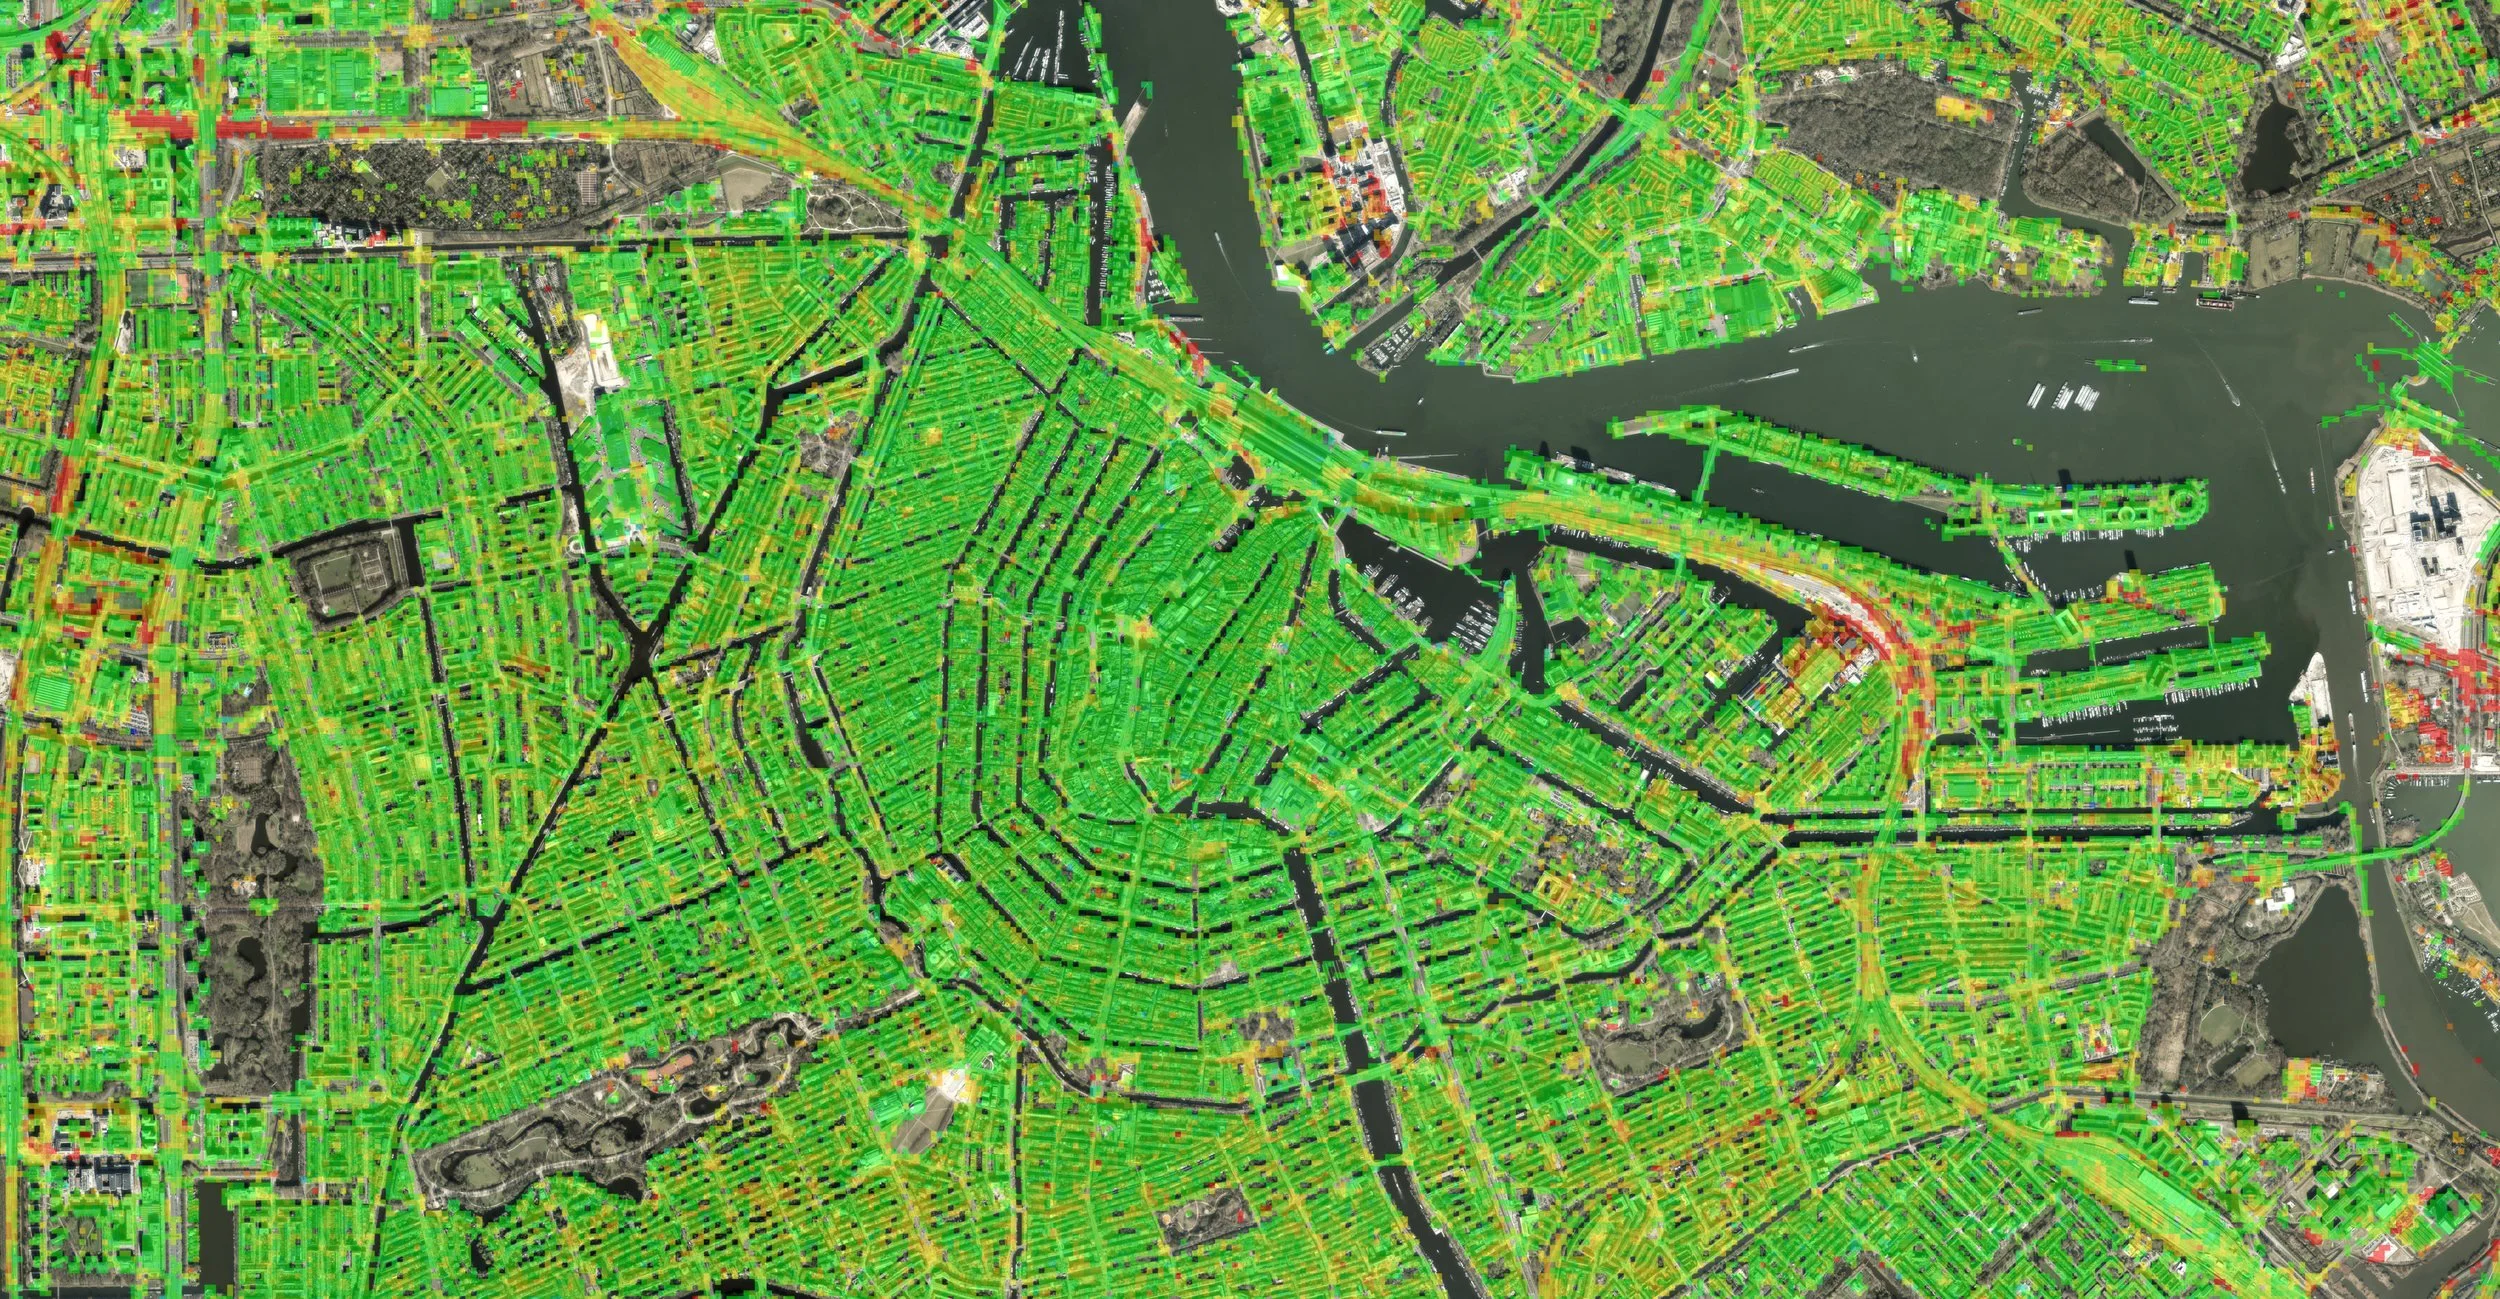
The Bodemdalingskaart shows how the ground across the whole of the Netherlands is moving, measured by radar satellites. The new version has measurements from October 2021 to July 2026, grouped into 20 m cells from billions of measurement points. It is free to use, needs no account, and is updated every quarter.
The Bodemdalingskaart is an initiative of NCG. TU Delft developed the methodology, and SkyGeo processes the satellite data and builds the viewer.
What the Map Shows
How fast the ground is moving anywhere in the Netherlands, in millimeters per year
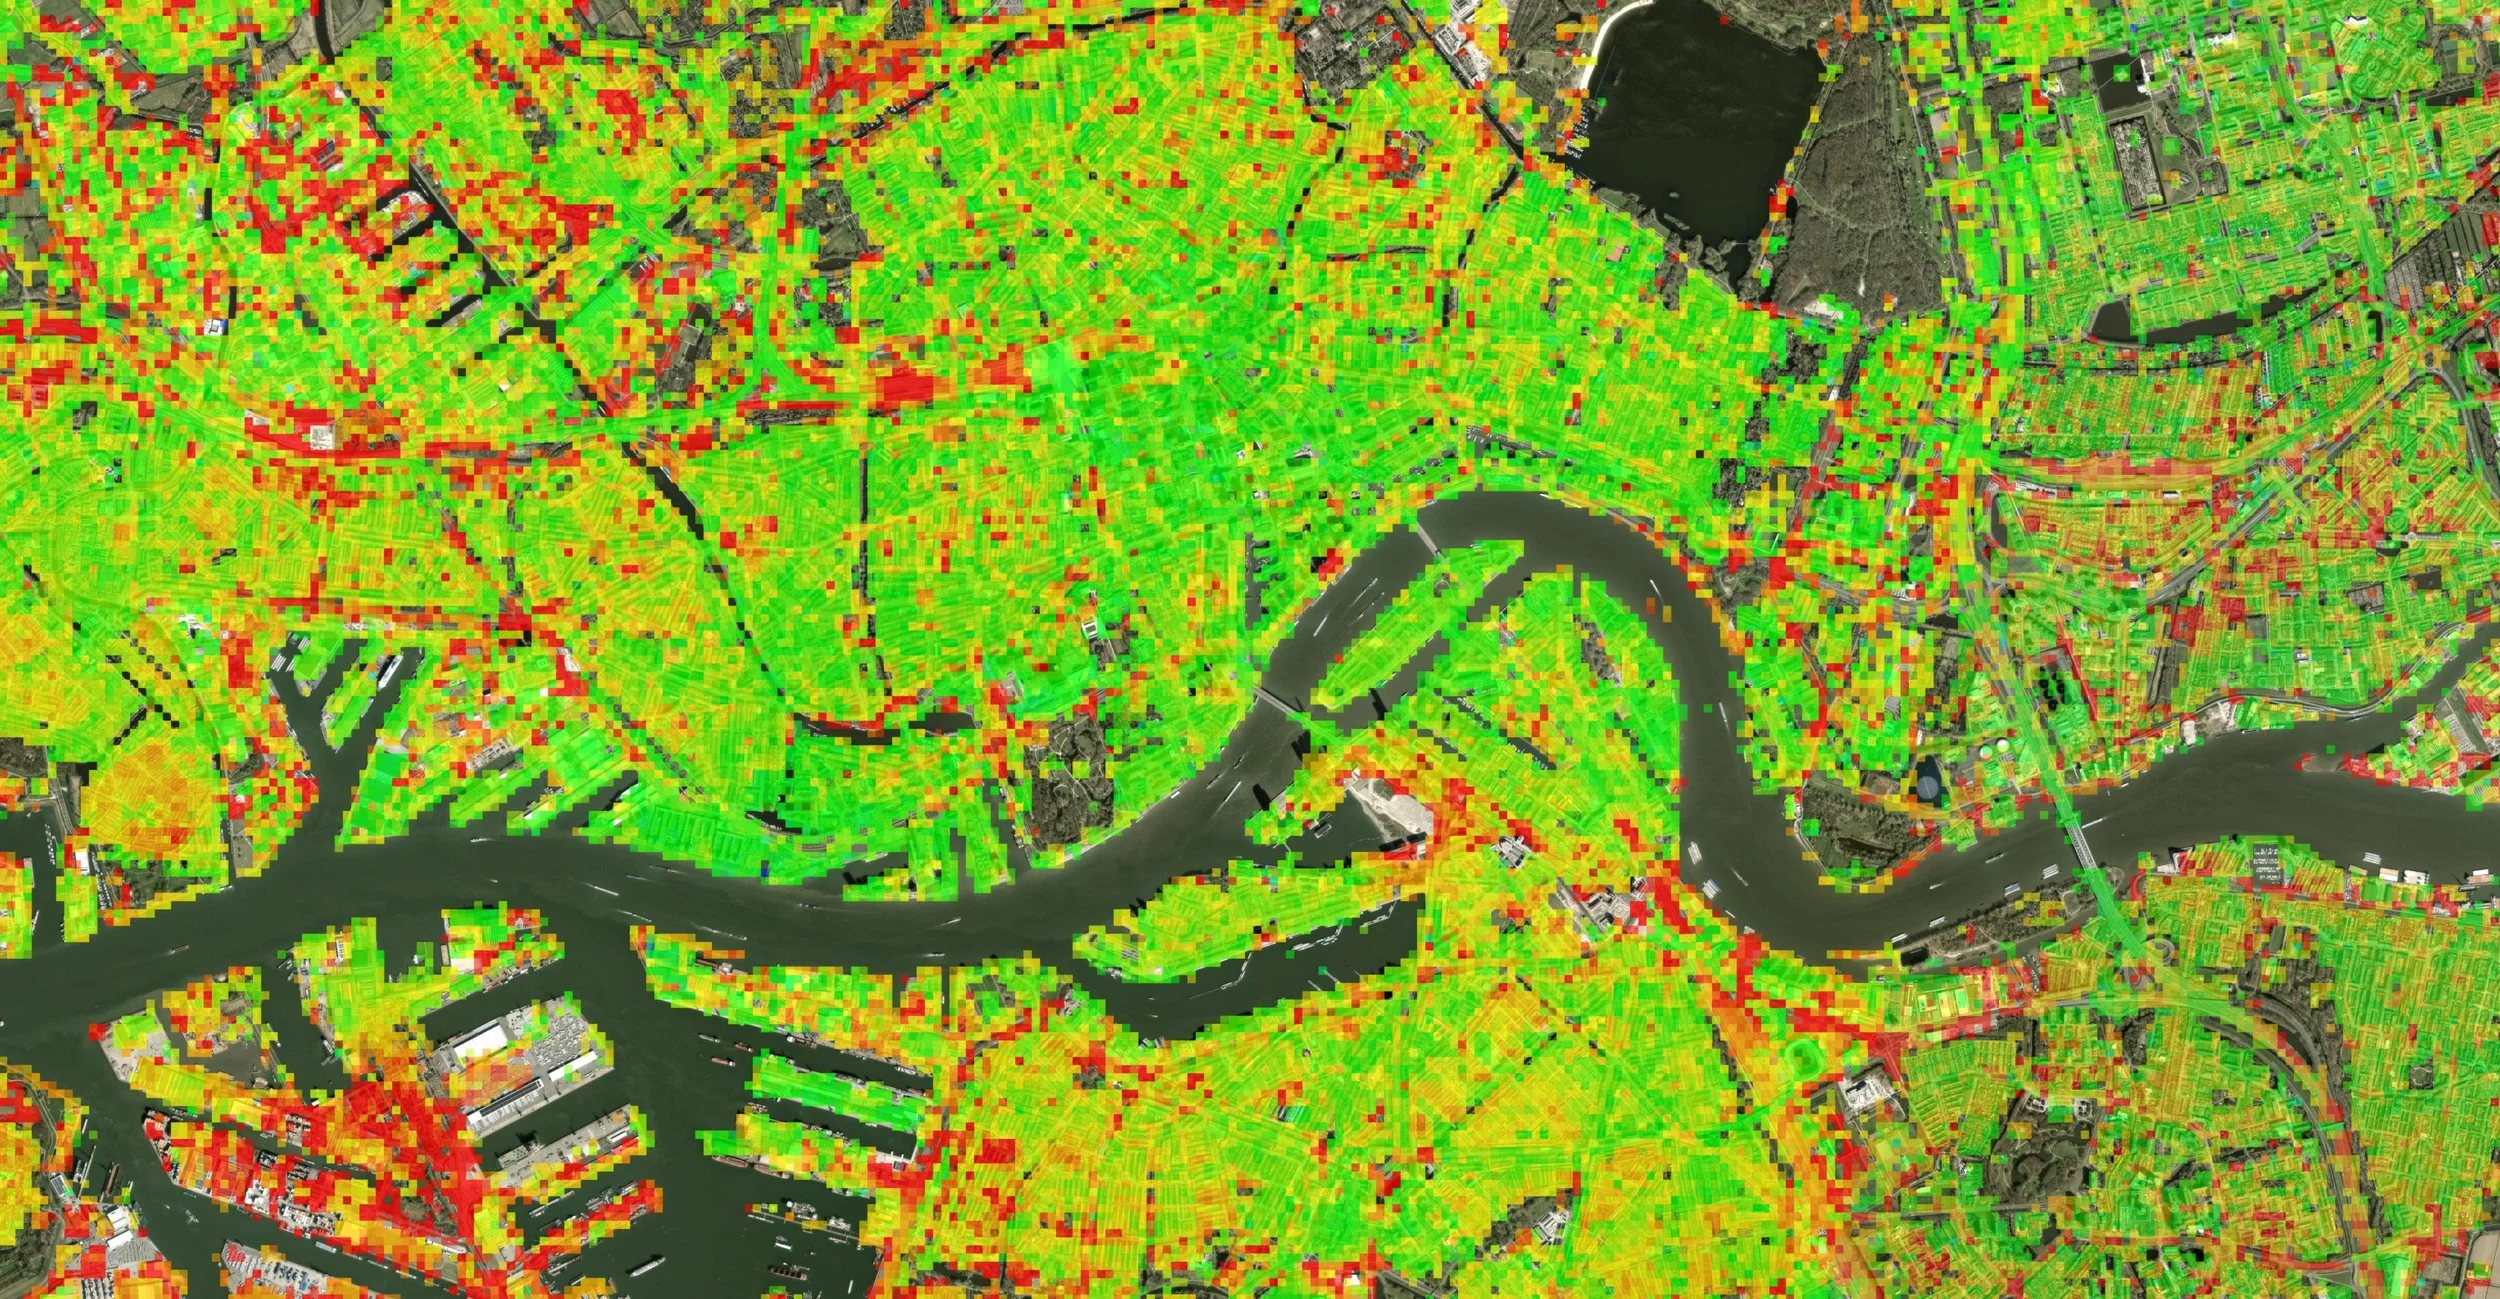
Where the ground is sinking (red), stable (green) or rising (blue), on a scale from minus 5 to plus 5 mm per year
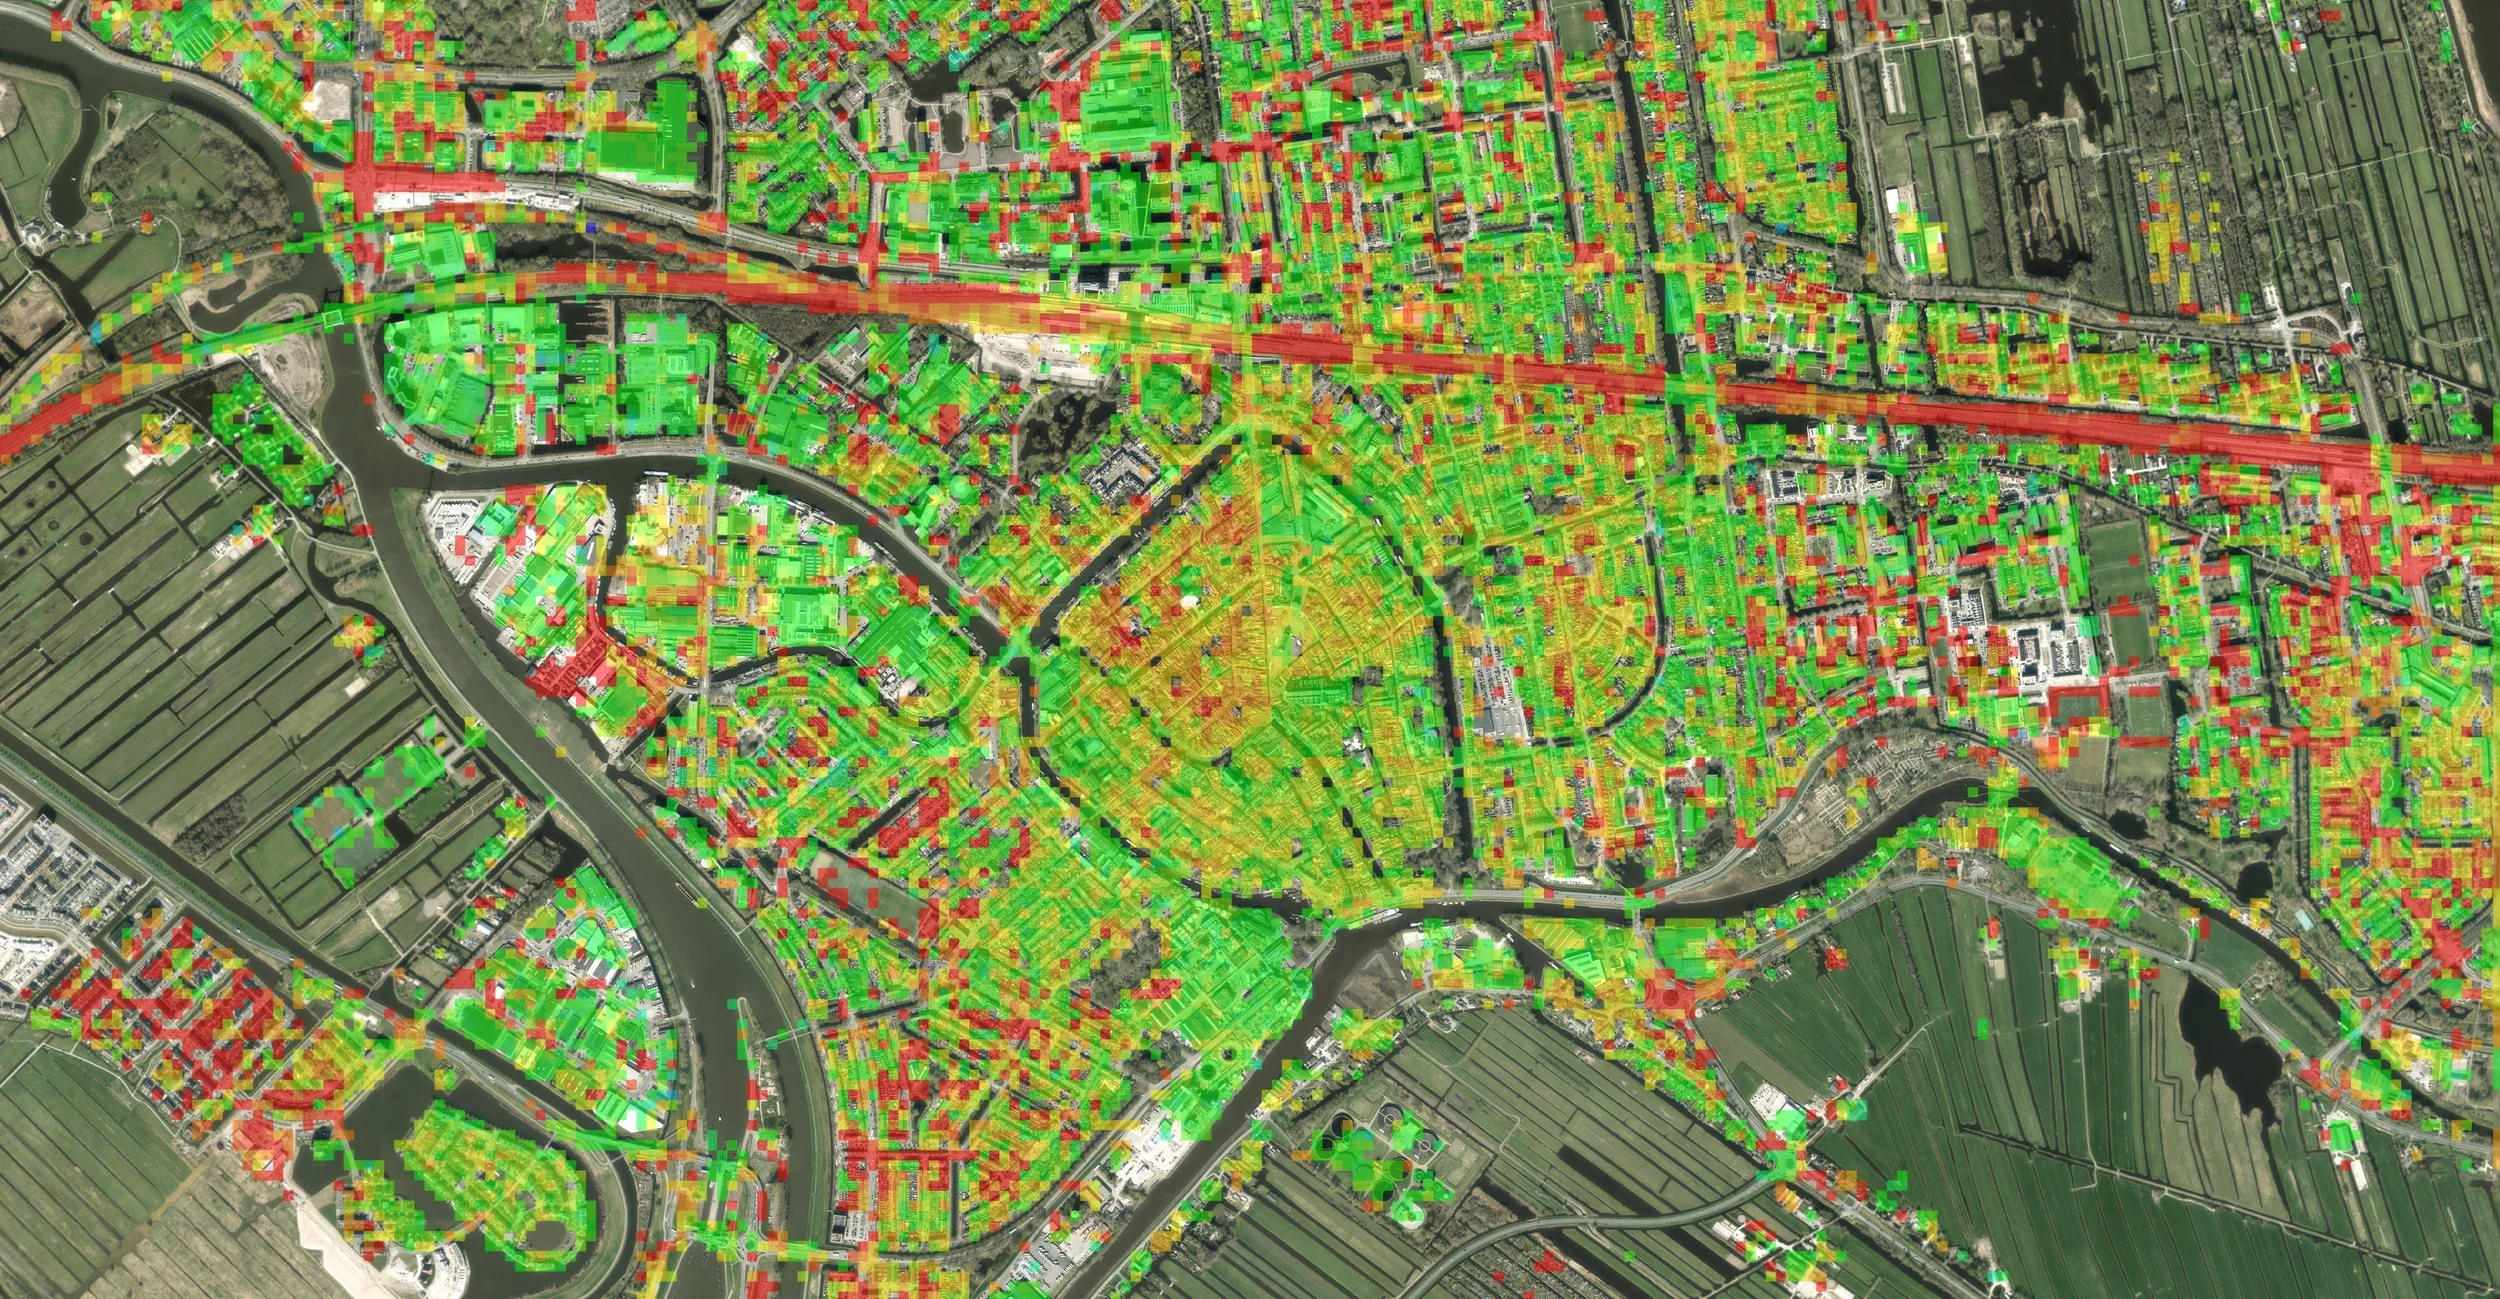
Movement across the whole country in 20 m cells, so differences between areas stand out
Ground, buildings, roads, dikes and quays, measured without sensors in the field
What's New
Measurements from October 2021 to July 2026
New measurements added every quarter, so the map stays current
Free access for everyone, with no account needed
A new website with explainers on infrastructure, foundations, new builds and rural areas
Pages on the causes of subsidence, how the measurements are made, and a FAQ
Worked examples, including road maintenance in Kockengen and foundations in Gouda

Who Uses the Bodemdalingskaart
Municipalities, for roads, sewers, quays, public space and spatial planning
Water boards, provinces and national government, for water, dike and soil policy
Engineering consultancies and contractors, to check how a site has moved before work starts
Network and infrastructure operators, to screen a whole network and decide where to look first
Housing corporations, lenders and insurers, to see where the ground under their homes is moving
Energy and extraction companies, for a national view over production and storage areas
Researchers and lecturers, as a national InSAR dataset for research and teaching
You can read more about how SkyGeo works with these sectors on the Civil Engineering and Energy pages.
From the Map to a Decision
The Bodemdalingskaart shows where the ground moves and how fast. When a project, network or portfolio needs more than a first look, SkyGeo's InSAR analysts can take it further:
Movement of individual buildings and assets, beyond the 20 m cells of the public map
Satellite data going back to 1992, for a longer history of a site
Analysis tailored to a site, a route or a property portfolio
Expert interpretation of what the movement means for your work
A National Map with a Track Record
An initiative of NCG
Methodology developed at TU Delft
Satellite data processing and viewer by SkyGeo
NCG presented the first Bodemdalingskaart in November 2018. It was the first national map to separate deep causes of subsidence from shallow ones. By 2020, version 2.0 held about 200 million measurement points. The new Bodemdalingskaart builds on that work and, with quarterly updates, keeps it current.
Frequently Asked Questions
-
The Bodemdalingskaart is the national map of ground motion in the Netherlands, measured by radar satellites. It is an initiative of NCG, built on a methodology developed at TU Delft, with the satellite data processing and the viewer by SkyGeo. Anyone can use it for free at bodemdalingskaart.nl.
-
Yes. The Bodemdalingskaart is free and you don't need an account. Municipalities, water boards, engineers, property owners and residents can all look up how the ground in their area is moving at bodemdalingskaart.nl.
-
The current measurements run from October 2021 to July 2026. From now on, new measurements are added every quarter, so the map keeps showing the most up-to-date ground motion measurements in the Netherlands.
-
Radar satellites pass over the Netherlands regularly and measure the distance to the ground and to buildings, roads and dikes. By comparing many passes over time, InSAR picks up movement of a few millimeters per year. The map groups billions of these measurements into 20 m cells.
-
The map shows movement across the whole country in 20 m cells. That makes it the right tool for a first look at an area, a site or a network. For the movement of individual buildings or assets, SkyGeo's InSAR analysts can run a tailored analysis.
-
No. The Bodemdalingskaart shows where the ground moves and how fast. Working out the cause, such as soft soil, groundwater, construction or deeper processes, takes expert analysis of the measurements together with other information about the location.
-
Red shows ground that is sinking, green shows ground that is stable, and blue shows ground that is rising. The scale runs from minus 5 to plus 5 mm per year.
-
SkyGeo can analyze a site, network or property portfolio in more detail, down to individual buildings and assets, using satellite data going back to 1992. This analysis is separate from the public map. Contact SkyGeo to arrange a call with an InSAR expert.
Let Us Know How We Can Help You
info@skygeo.com