
California Resources Corporation Case Study
Fine-tuning Water and Steam Injection in EOR Diatomite Project, Bakersfield, California (USA)
Our customer continuously adjusts water injection for over 500 producer and injector wells to minimize the risk of both well casing damage and surface spills. SkyGeo has been delivering an operational InSAR service using TerraSAR-X and repointing every 11 days over a growing number of leases - now up to 22.
With these measurements of induced subsidence and uplift, we effectively help identify locations of over-, or under-injection continuously. And we help predict and prevent a whole series of environmental problems.
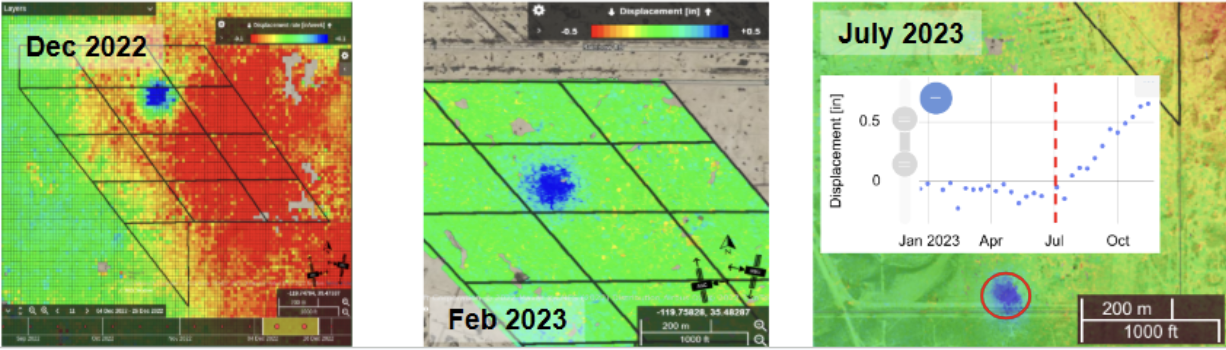
Figure 14: Samples of the SkyGeo surface subsidence and uplift map over the diatomite. For 30,000 points per square mile, we show how much the surface has gone up or down in the last 11 days. Production causes regional subsidence (red) whereas overpressure causes uplift locally, typically with a circular footprint (blue). This dynamic view of surface motions is translated into insights about excessive subsidence or uplift. Production engineers adjust the flow rate settings on the water injectors to mitigate these effects. Blue "blisters" are clearly visible.
Waterflooding diatomite
Our customer operates a series of on-shore leases. The most challenging ones are diatomite field with hundreds of vertical production wells. Extraction from the high porosity, low permeability diatomite payload causes compaction, production loss and well casing damage.
We have helped build a feedback loop to reduce subsidence from 30 cm/yr to < 10 cm/yr, thereby extending the mean time before failure of all wells. Production-induced well casing damage is a major factor affecting the field’s economics: hundreds of wells have already been decommissioned since the start of production.
Measuring subsidence and uplift
The fluid displacement (and replacement) can be deduced from the SkyGeo surface deformation maps: we produce same-day measurements of subsidence / uplift response above ground every 11 days for all leases. d apply the InSAR technique to update reservoir engineering with information about surface motions.
oil-to-surface have highly negative effects: shutdown and fines by the state of California. But they are hard to measure and hard to predict. Prior to actually surfacing, the fluid “pushes up” the rock above. The typical uplift pattern in the InSAR measurements is distinctly circular (blue in the figures), guiding where flow rates can be reduced. Surface events are infrequent but costly, and now there is a better way to prevent them.
Response: fine-tuning water injection
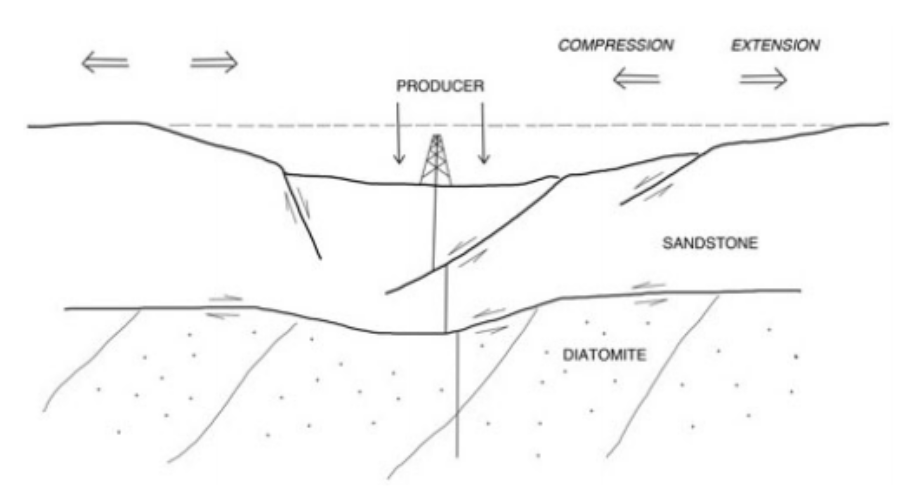
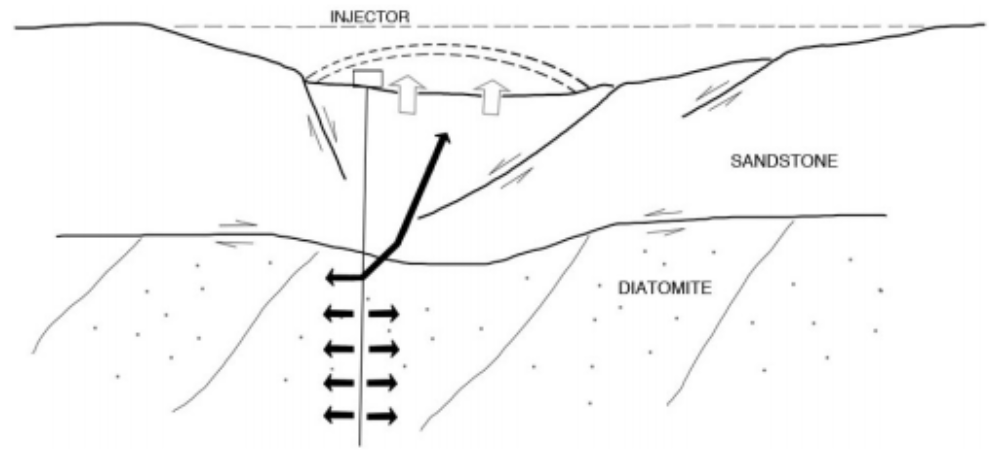
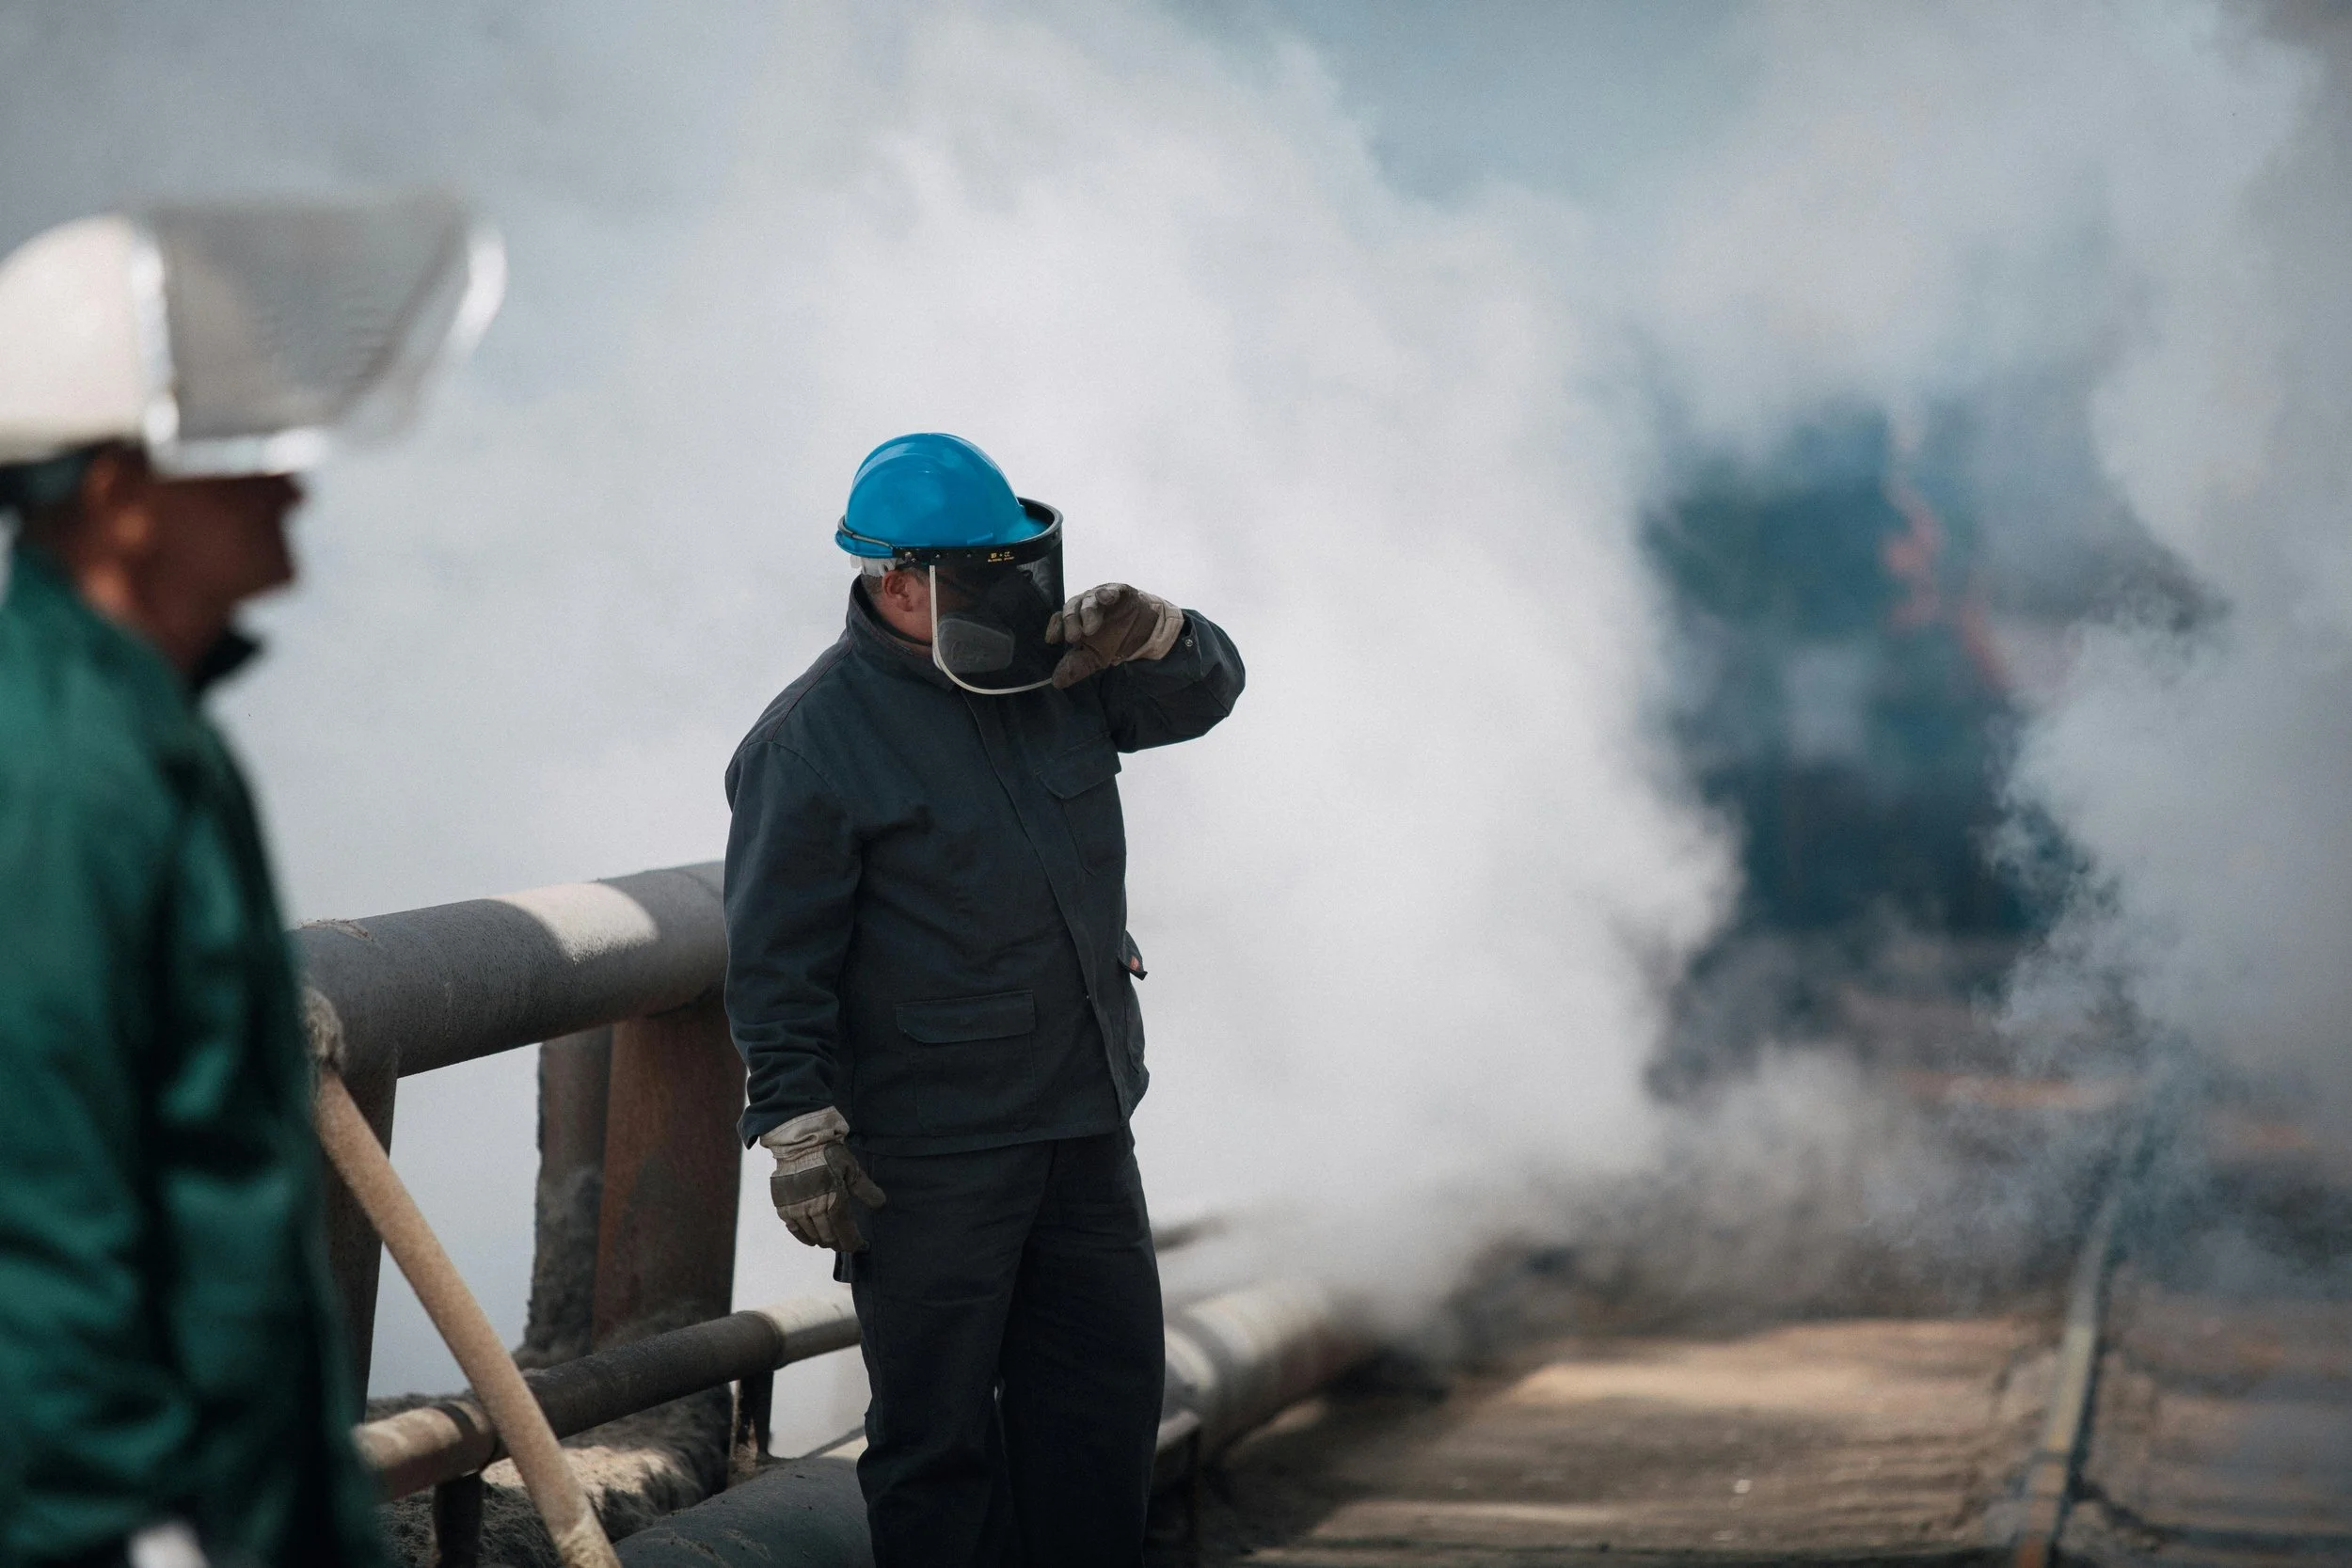
Figure 15: Compaction in the diatomite and associated well casing damage patterns. Most damage happens where shear stresses are largest: at the non-conformity between the diatomite and the overlaying sandstone. LEFT. Effective waterflooding strategies mitigate the effect that compaction in the payzone has on well casing and allow for long term stable production. RIGHT. InSAR indicative of excessive pressure typically presents as a circular uplift pattern AKA a blister at the surface. Leaking wellbores cause oil-to-surface events - but we now prevent them with 100% success.
Post time series: Cumulative Sum
The opposite of smoothing changes matter
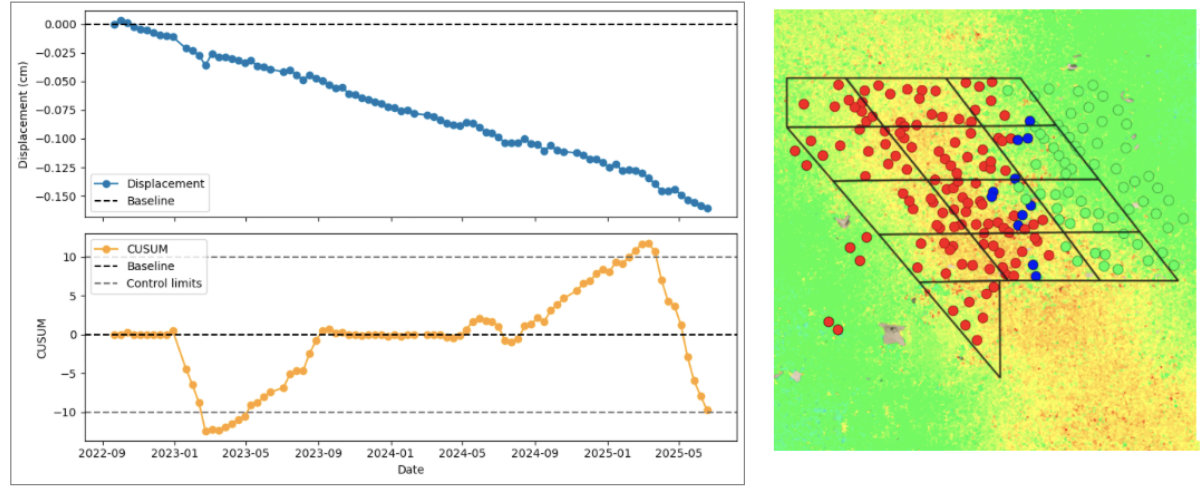
Figure 16: LEFT TOP in Blue time series showing vertical subsidence data over 2+ years for an individual injection wellbore. Subsidence is steady over time. LEFT BOTTOM In orange the cumulative sum product derived from the time series, to highlight small deviations from a background subsidence signal. Where well is shown in red, Cumulative is <0, the three is a downward deviation from the steady trend. On the RIGHT we show wells deviate for a certain time. We can appplpy similar to any well or cluster of wells for PDO.
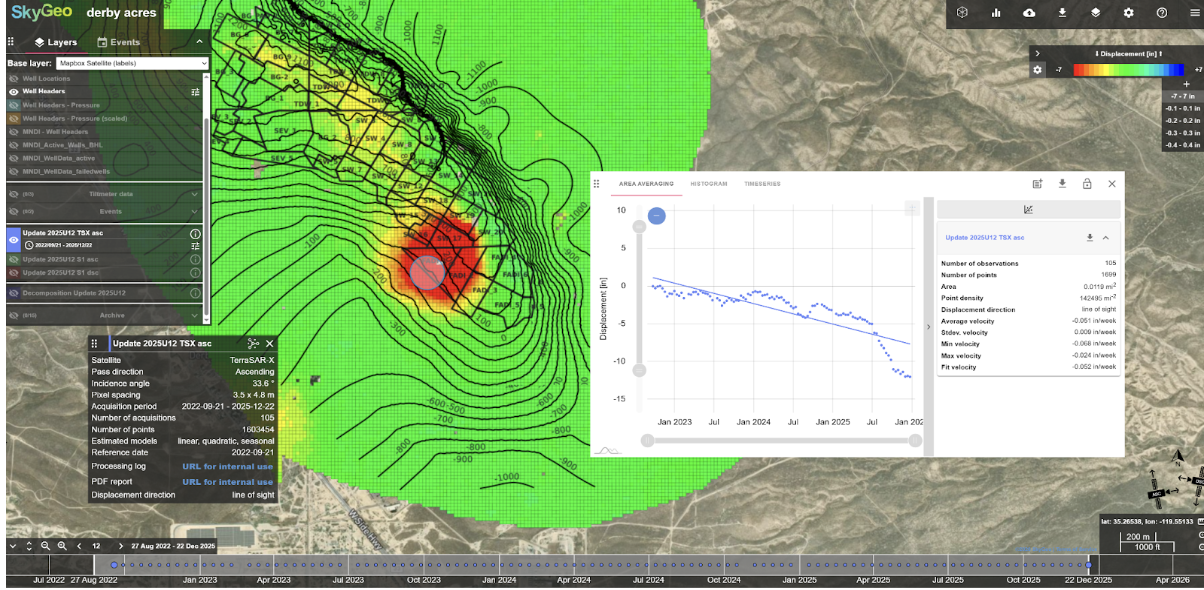
Figure 17: Steam flood in diatomite. Showing the top of the formation in black contour lines. Time series showing vertical subsidence data over 2+ years for a well pad. The total subsidence is 28 cm and accelerating. This TSX InSAR data is updated and reviewed every 11 days.
All in all, with California Resources Corporation we have incrementally grown the number of users working with the InSAR data, trusting it to inform their day-to-day work. We now provide corporate visibility on the effectiveness and Return on Investment of the service.
We have increasingly gotten better at understanding the inversion of the surface data semi-quantitatively to help the reservoir and asset managers take real decisions. We meet with several asset teams and help them in their work every month.
Oil & Gas Case Studies
-

Brunei Shell Petroleum
By monitoring both offshore platforms and onshore infrastructure with InSAR, Brunei Shell Petroleum can detect subtle deformation early and integrate these insights into geomechanical models and production decisions.
-
NAM
Through long-term InSAR monitoring across the Groningen region, NAM gains detailed insights into subsidence and reservoir behaviour, supporting seismic risk assessment and regulatory reporting.


Frequently Asked Questions
-
InSAR measures ground deformation across large regions with millimetre precision. By analysing time-series satellite data, operators can track subsidence caused by reservoir compaction and understand how production affects ground movement and seismic risk.
-
Yes. InSAR is often combined with ground-based monitoring networks such as GPS stations and levelling surveys. Integrating these datasets allows operators to validate results and build more accurate geomechanical models of reservoir behaviour.
-
Long-term InSAR monitoring helps operators understand how reservoirs respond to production changes, including compaction during extraction and surface rebound after shutdown. These insights support long-term risk management and regulatory reporting for subsidence monitoring.