
KANSANSHI CASE STUDY
INSAR TECHNOLOGY REDUCES LANDSLIDE DISPLACEMENT BY 50% IN THE KANSANSHI PIT
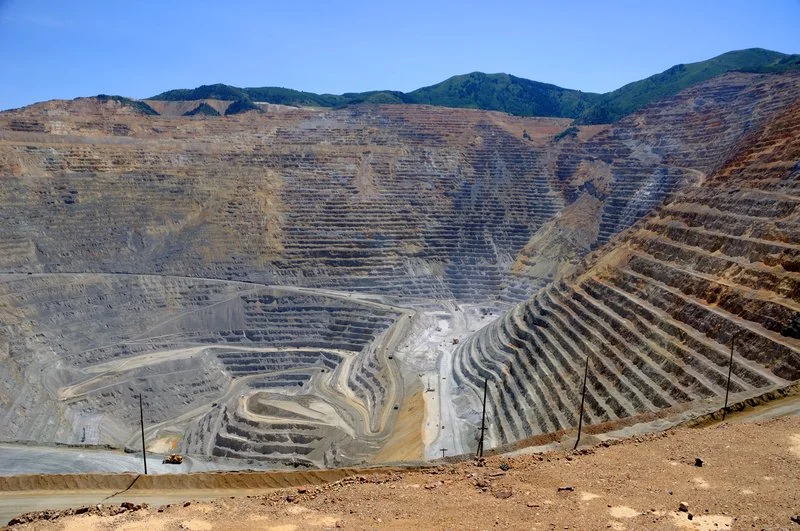
The Kansanshi Mine , located in Zambia, stands out as Africa's largest open-pit gold and copper mine. With pits extending up to 3 km and situated in a geologically complex environment of dolomite, marble, and schistose rock, slope stability is crucial for the mine's safe and efficient operation. First Quantum Minerals Ltd. (FQML) has achieved a remarkable 50% reduction in slope displacement through the implementation of advanced interferometric synthetic aperture radar ( InSAR ) technology.
Risks and focus on slope stability in Kansanshi mine.
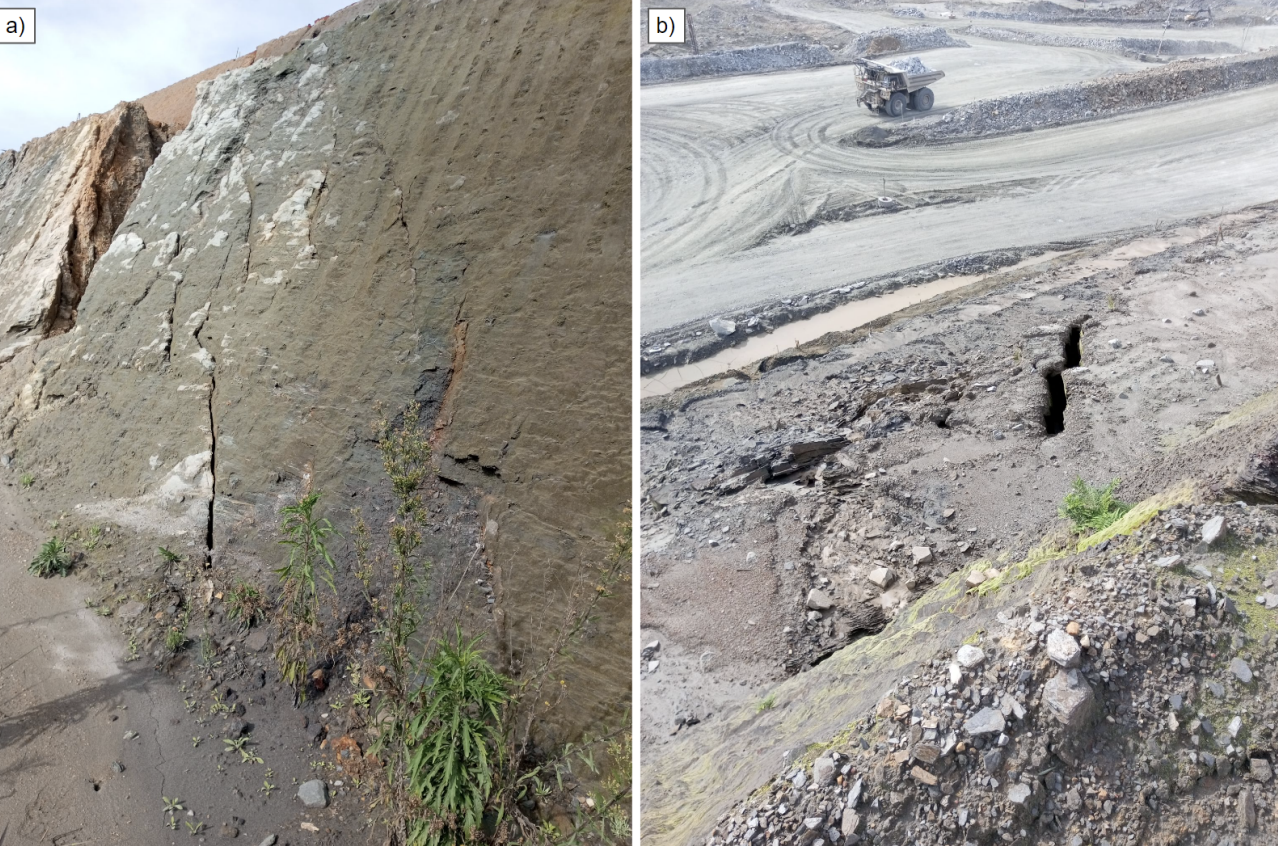
The frequent slope instability at the Kansanshi Mine was due to multiple factors, including eroded materials, high water pressure, and structural variations in the rock. These conditions increased the risk of landslides, which could lead to operational disruptions and endanger worker safety. Ensuring stability in critical areas such as the upper slope of M15 became a top priority for FQML.
Eroded materials : Constant erosion weakened the integrity of the slopes, increasing the likelihood of landslides.
High water pressure : The accumulation of water on the slopes increased the pore pressure, contributing to the instability of the terrain.
Structural variations: The complex geology of dolomites, marbles and schistose rock presented additional challenges to maintaining the stability of the slopes.
Details
Industry: Mining
Use Case:
Product:
Innovative early ground monitoring with InSAR
In response to these challenges, FQML adopted InSAR technology in 2021, provided by SkyGeo , to monitor and manage ground movement more effectively. The InSAR system uses interferometric synthetic aperture radar to obtain high-resolution images of the terrain, enabling the precise detection of minute displacements that could indicate future inconsistencies.
The implementation of InSAR has had a significant impact on the safety and operating costs of the Kansanshi Mine. Through continuous data collection and analysis, SkyGeo has issued early warnings that have allowed FQML's geotechnical team to proactively mitigate risks.
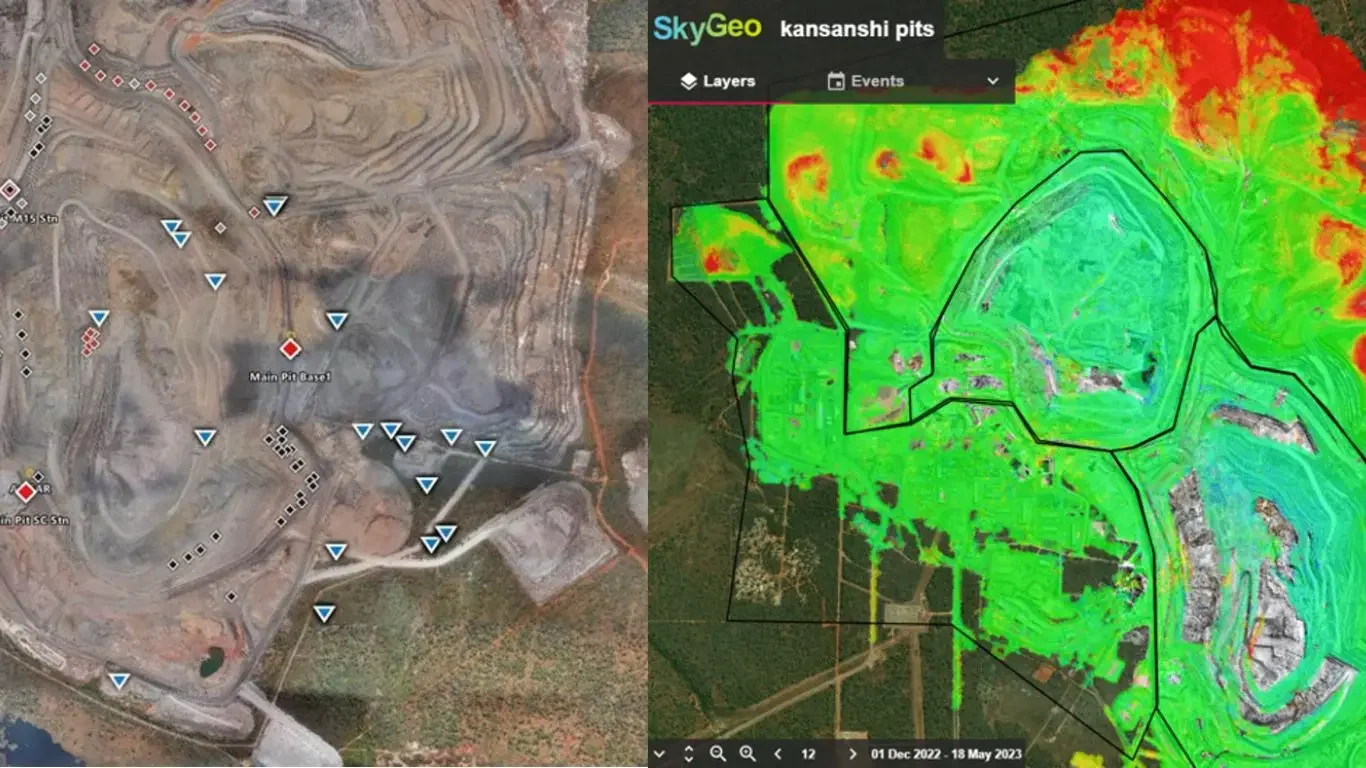
Monitoring was conducted using the following methods (left image): visual inspections, ground-based radar, robotic total station setups (red diamonds), prisms with total stations (black diamonds), and piezometers (inverted blue triangles). InSAR was used from 2021 to supplement existing ground-based systems on a quarterly basis and cover a larger area (right image). The frequency was changed to monthly when an alert was issued for the M15 wall and increased to every 11 days as InSAR became a critical monitoring tool.
Key benefits of InSAR in Kansanshi
Risk reduction : The ability to detect minimal displacements has allowed for early intervention, reducing the risk of major landslides.
Cost optimization : Landslide prevention and early intervention have reduced the costs associated with repairs and downtime.
Improved worker safety : By ensuring the stability of the slopes, a safer working environment has been created for mine employees.
InSAR insights drive implementation of proactive solutions
Thanks to alerts issued by InSAR, FQML has been able to implement effective solutions such as the installation of horizontal drains and relief wells to reduce water pressure on the slopes. Furthermore, SkyGeo's Antares platform has facilitated the prioritization of high-risk areas using color-coded risk levels, enabling rapid interpretation and response by the geotechnical team.
Real-time monitoring and alerts
In mid-2022, data from InSAR revealed progressive displacements along the western face of the M15 slope, with rates as high as -101 mm/year . These displacements formed a circular subsidence pattern, indicating a potential slope collapse. Thanks to real-time monitoring, FQML was able to intervene promptly to avert a potential disaster.
Tangible results
50% reduction in displacements : The implementation of InSAR has significantly reduced slope movement, improving the overall stability of the mine.
Prevention of operational interruptions : The ability to detect and mitigate risks has allowed the continuity of mining operations to be maintained without major interruptions.
Increased operational confidence : Technology has strengthened FQML's confidence in its risk management strategies and the security of its facilities.
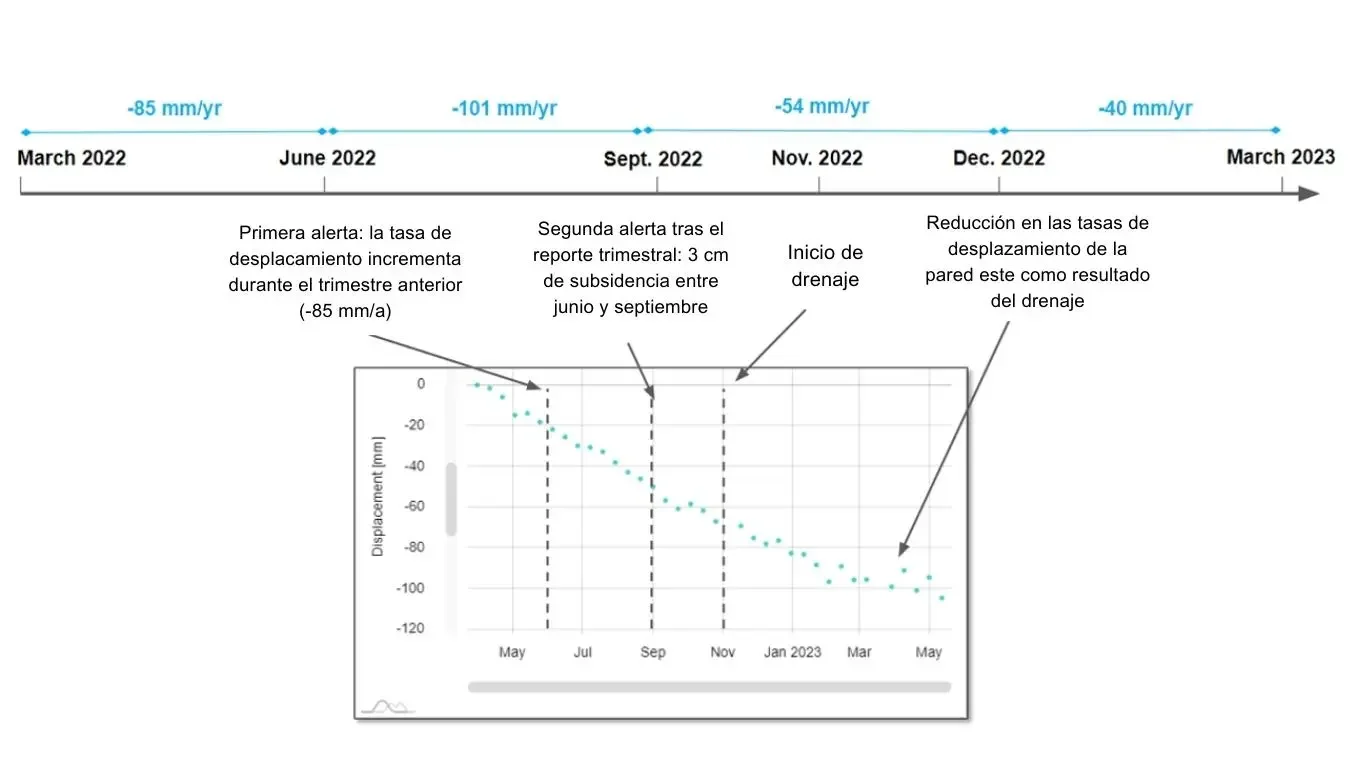
Topographic surveys further assessed the situation, and subsequent updates and consultation sessions led us to focus on these areas. From that point onward, topographic surveys in this part of the site were intensified. The timeline illustrates the sequence of events from June 2022 to November 2022, as well as the positive outcome. All of this was made possible by the proactive measures implemented with guidance from SkyGeo and InSAR.
Significant progress in Mining Risk Management
The adoption of InSAR technology and working with the SkyGeo InSAR experts has been a game-changer for First Quantum Minerals Ltd. at the Kansanshi Mine. By providing a reliable, high-resolution source of ground movement data, InSAR has enabled proactive management of risks associated with slope instability, ensuring worker safety and the continuity of mining operations.To learn more about advanced geotechnical monitoring solutions and risk management technologies, visit our website and explore our related articles on InSAR technology.
MIning Case Studies
-
Potash Mining Company
Leveraging SkyGeo’s holistic approach to managing geotechnical risk, the client now identifies sinkholes as early as possible and minimizes the probability of a catastrophic collapse causing dike failure.
-
Kansanshi Copper Mine
Stabilisation of open pit wall movements detected by InSAR using horizontal drains


Frequently Asked Questions
-
InSAR is used to monitor deformation across open pits, waste dumps, tailings facilities, and surrounding infrastructure. It provides wide-area time-series visibility that complements on-site monitoring, helping teams understand where movement is changing and where attention is needed.
-
Yes—when interpreted correctly. Time-series trends can reveal subtle changes that may indicate evolving conditions. Expert interpretation is important to separate signal from noise and to understand what patterns are meaningful for geotechnical risk.
-
No. InSAR complements ground-based monitoring and inspections. It can help prioritise where to look and provide broader context over time, but decisions should integrate multiple data sources and engineering judgement.
-
InSAR provides wide-area, time‑series visibility of surface deformation across an entire mine site—including pits, dumps, and tailings facilities. When interpreted correctly, it helps identify where movement is changing over time so teams can prioritise inspection, monitoring resources, and mitigation planning.
-
InSAR can help characterise and quantify deformation trends across TSFs and surrounding ground, supporting early awareness and prioritisation. Because TSFs are high‑consequence assets, results should be interpreted by specialists and integrated with site monitoring and geotechnical context to support safe decisions.
-
Early warning means identifying abnormal movement patterns or changes in trend early enough to trigger closer review or additional on‑site investigation. Practical early warning depends on a site‑specific framework: baselines, thresholds, and expert interpretation—not a single universal number or map.
-
Data-only outputs can be easy to misread, especially in complex mine environments. SkyGeo combines InSAR data with geotechnical domain expertise, quality controls, and interpretation workflows to translate measurements into clear, risk‑aware insight that supports decisions and safe operations.
-
Satellite monitoring supports TSF safety programmes by providing consistent, independent observations of deformation patterns over time. It helps demonstrate due diligence, supports audit trails, and can highlight trends that warrant closer investigation. Importantly, TSF risk management depends on interpretation—understanding what movement is expected, what is abnormal, and how change relates to site conditions and operational actions. Satellite monitoring is most effective when it sits within a governance framework: thresholds, responsibilities, validation steps, and clear escalation pathways.
-
Satellite monitoring can identify deformation trends that may indicate changing conditions, but it should not be treated as a simple ‘failure prediction’ tool. Tailings failures are complex and often depend on multiple interacting factors. The responsible use of satellite data is as an early-warning and screening layer: detect change, assess trend behaviour and uncertainty, then investigate with engineering judgement and complementary monitoring. Overconfidence in raw data outputs can be dangerous; decision-grade insight requires expert validation and context.
-
Typical parameters include displacement over time (time-series), velocity (rate of movement), acceleration (change in rate), and spatial patterns such as differential movement across the structure and its surroundings. Context matters: movement direction relative to the dam geometry, correlation with operational changes, and consistency across measurement points. Monitoring programmes also track uncertainty and data quality so interpretation remains reliable. The aim is not to ‘collect points’, but to detect meaningful change early and support clear escalation decisions.